What to Watch

It is better to deserve honors and not have them than to have them and not deserve them.
Mark Twain
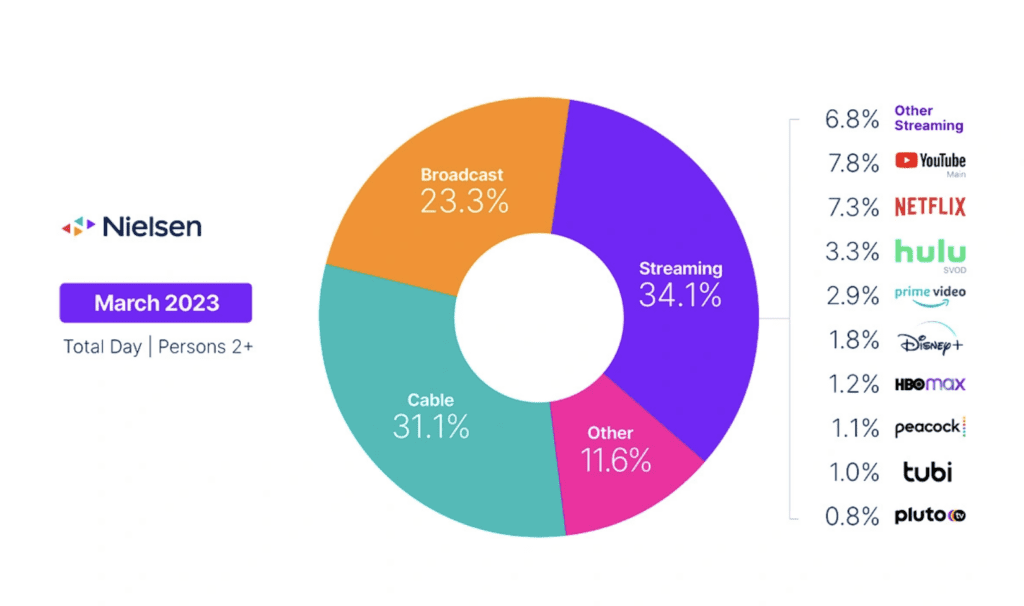
What We Watch & Where We Watch It
The Gauge provides a monthly macroanalysis of audience viewing behaviors across key television delivery platforms, including broadcast, streaming, cable and other sources.
It also includes a breakdown of the major, individual streaming distributors.
The chart itself represents monthly total television usage, broken out into share of viewing by category and by individual streaming distributors.
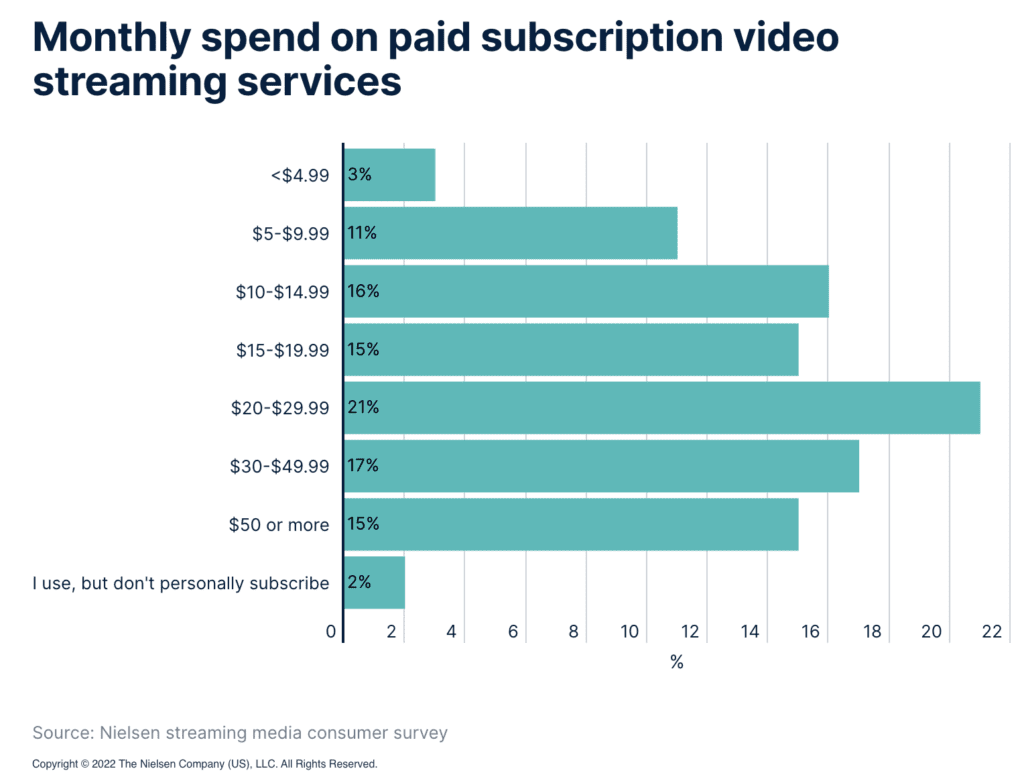
Monthly Spend on Paid Subscription Video Streaming Services
As detailed in Nielsen’s State of Play report, audiences have more than 817,000 unique program titles to choose from across traditional TV and streaming services.
That’s up 18% from just over 646,000 at the end of 2019. While many titles form the bedrock of the traditional TV universe, an increasing amount is being developed for streaming services, and audiences are eating it up. In an average week, U.S. audiences watch almost 170 billion minutes of video content.
That’s up from just over 143 billion a year ago. In step with shifting consumer behaviors, media companies are increasingly adopting streaming-first mindsets, and the number of available services continues to rise to meet audience demand.
Amid the growing number of platforms, which some estimate exceeds 200, consumers are feeling overwhelmed.
In fact, 46% of viewers say it’s harder to find the content they want to watch because there are too many services available.
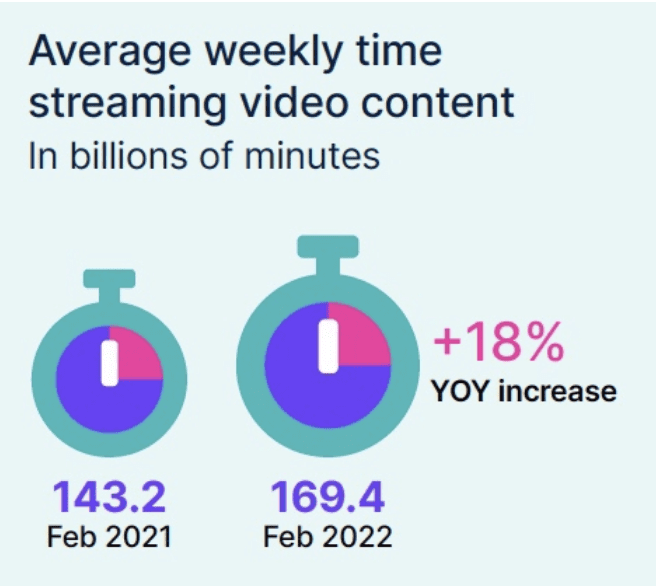
Average Weekly Time Streaming Video Content
The list of unique program titles in the U.S. tops 817,000 and continues to grow, much like the array of streaming platforms and apps that deliver many of those titles.
There is no mistaking consumer appetites for streaming content, as 72% of Americans say “I love my user experience with video streaming services,” and 93% plan to increase their streaming options or make no changes to their existing plans.
But the vastness of platform choice has become overwhelming for audiences.
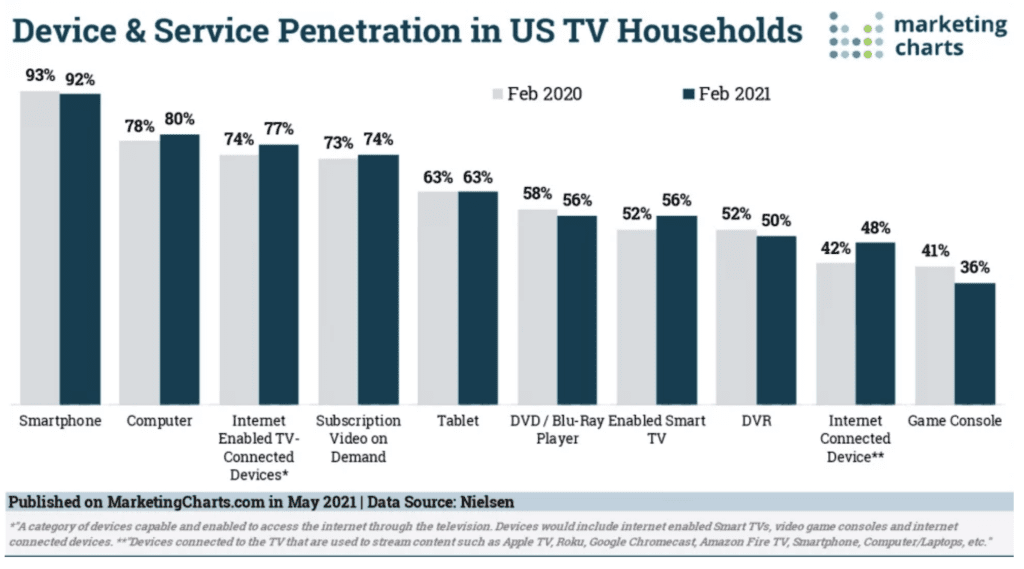
Device & Service Penetration in US TV Households
McKinsey found that more than one-third (36%) of the US adults surveyed spent more time streaming video last year. Perhaps as a consequence, ownership of internet-enabled TV-connected devices increased from 74% in February 2020 to 77% in February 2021. Adoption of these devices is even higher among Asian Americans (90%) and Hispanics (84%).
The percentage of households with internet-connected devices such as Roku, Fire Stick and Apple TV reached 48%, up from 42% last year, while SVOD service adoption saw a slight lift to 74%. Once again, Asian Americans over-index in ownership of internet-connected devices — 61% of Asian Americans currently own at least one of these devices.
The share of TV households with an enabled Smart TV has increased over the last year as well, with 56% now owning this device. This increase coincides with the remarkable increase in time spent viewing streaming video on Smart TV globally.
The Difference Between Network TV, Cable, And Streaming
What to Watch – Networks
What to Watch – In the United States, the networks (also known as broadcast television) are ABC, NBC, CBS, FOX, and The CW. Like radio, these networks are nationally transmitted through local affiliates or owned-and-operated stations and can be picked up through a TV antenna. Of course, now viewers can also access them digitally or through cable providers.
Since the networks are nationally broadcast over public channels, they are subject to federal regulations and oversight from the Federal Communications Commission (FCC).
All content services profit through various means, but the broadcast networks primarily make revenue by selling advertising space (commercials) during their programming blocks.
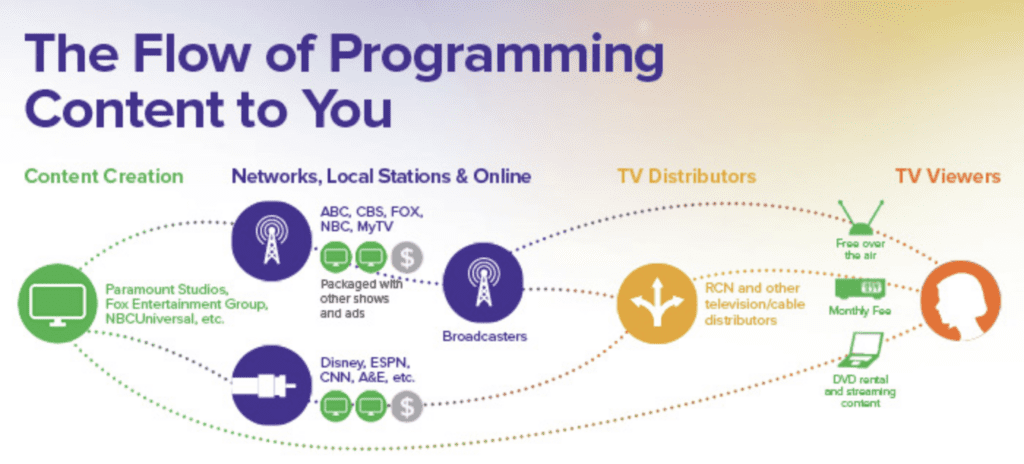
What to Watch – Cable
Like broadcast TV, cable gets its name by how it’s transmitted to you, which is through coaxial or fiber-optic cables. Unlike networks, cable channels, like AMC, USA, TNT, FX, Freeform, etc., are not tied to local affiliates and have control over their full 24 hours of programming. These channels also make money through ad revenue, so while they often still debut original programming during the Sunday-Friday primetime slots, they supplement with re-airings and acquired content.
What to Watch – Premium Cable
Premium cable channels (HBO, SHOWTIME, STARZ, etc.) require subscriptions that can be added to your existing cable package or, more recently, can be accessed digitally. Since these channels rely on subscriptions and not ad revenue, they don’t air commercials during their programming.
What to Watch – Streaming
Content from streamers is accessed and viewed via the internet directly from the service’s platform. In many cases, streaming services like Netflix, Hulu, Amazon Prime, etc., act more like digital content libraries than traditional channels. While each service is different, many offer a mix of original and acquired content with new shows accessible at midnight instead of at a designated time like network and cable channels.
According to Nielsen’s latest Total Audience Report, television is still the most used electronic medium for U.S. adults. On average, Americans aged 18 and older spend more than four hours a day watching TV, still beating the three hours and 45 minutes they interact with their smartphone on an average day by roughly half an hour.
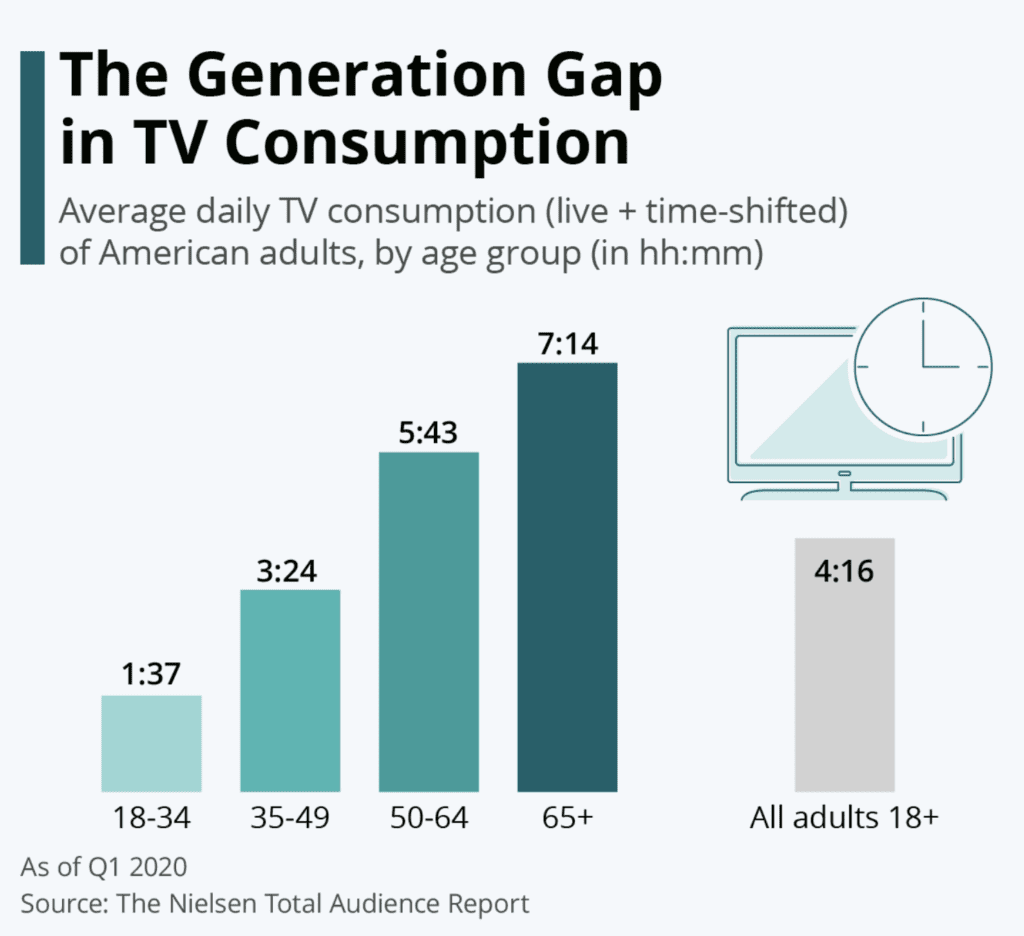
The Generation Gap in TV Consumption
While these findings certainly show that television is still relevant and shouldn’t be written off prematurely, a closer look reveals a trend that could spell doom for TV networks in the long run. According to Nielsen’s findings there is a large generation gap in TV consumption. While those aged 50 and older spend close to six (ages 50-64) and more than seven hours (ages 65+) a day in front of the tube, young adults watch significantly less TV.
While some of this difference might be explained by the fact that many people over the age of 65 are retired and thus have more time to watch TV, the fact that younger people are more likely to use streaming services such as Netflix and Amazon Prime Video instead of watching “traditional” TV likely plays an even larger role in this.
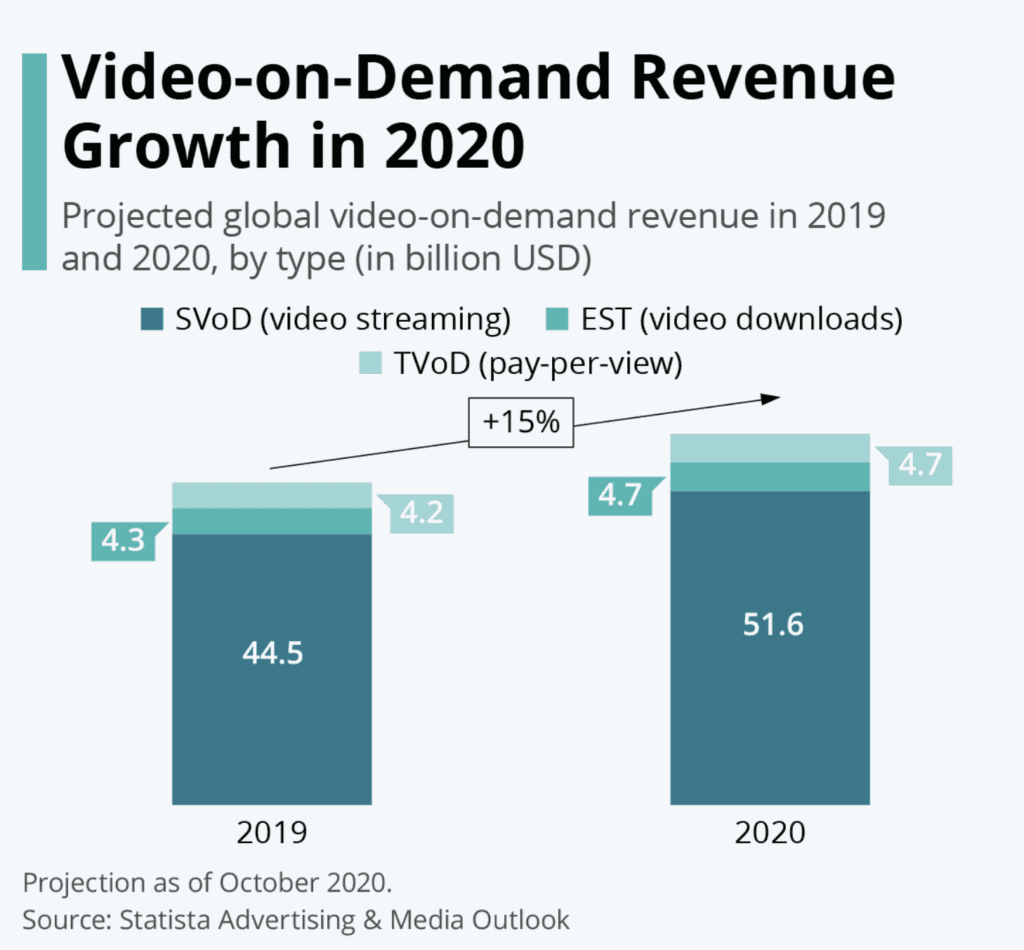
Video-on-Demand Revenue Growth in 2020
Video-on-demand services are popular at the best of times, but with the coronavirus pandemic and the lockdowns introduced in reaction to it, also came a significant boost in consumer spending on services such as Netflix and Disney+. As data from the Statista Advertising & Media Outlook projects, 2020 will see a 15 percent increase in global spending on SVoD, EST and TVoD services, amounting to a total $61 billion.
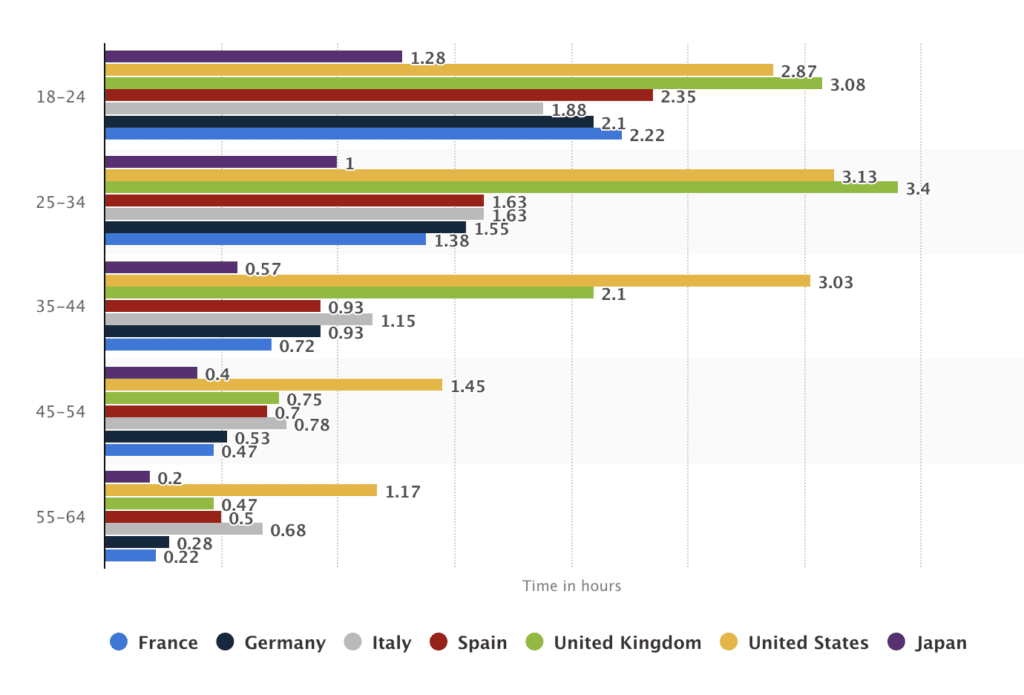
Daily on-Demand TV Viewing Time in By Country By Age Group, 2018
Data on the average amount of time people in different countries spend watching TV on-demand showed that Americans aged between 18 and 24 years old watched 2.87 hours of TV on-demand per day, while people from Italy in this age group only watched 1.88 hours per day.
Video Streaming Trends: The Popularity of Streaming Services
A recent Comscore report states that 72% of households with WiFi now stream video on their connected TV (CTV) screens. Also, Comscore writes that there was a massive increase in CTV viewing this year. Namely, the number of CTV streaming homes increased from 44 million to 50 million. So, this is a truly massive market in 2020.
While researching this year’s streaming trends, we concluded that there are four players that stand out — Netflix, Amazon Prime, Hulu, and Disney+. Comscore reported that these four streaming providers accounted for 82.5% of CTV streaming hours.
From relatively humble beginnings as a DVD-by-mail service, Netflix has grown into one of the most influential video streaming services in the world. The company was one of the first to see the potential of video streaming technology and began to transition to a subscription video-on-demand model in 2007. Since this transition, Netflix’s revenue has grown from 1.36 billion to around 15.8 billion in just ten years. The number of Netflix subscribers has followed a similar trend, growing from less than 22 million in 2011 to nearly 150 million in 2019.
What to Eat While Binge Watching >>
What to Drink While Binge Watching >>
What to Watch – Billy Bob Thornton in Goliath >>
Binge on The Playbook on Netflix >>